ProMOS®
MES Software — Industrial Production Control & OEE
The ProMOS® MES module records production shift by shift in the plants of world leaders — OEE, stops, losses and real-time panels. Gains of up to +14 p.p. of OEE documented in real plants.
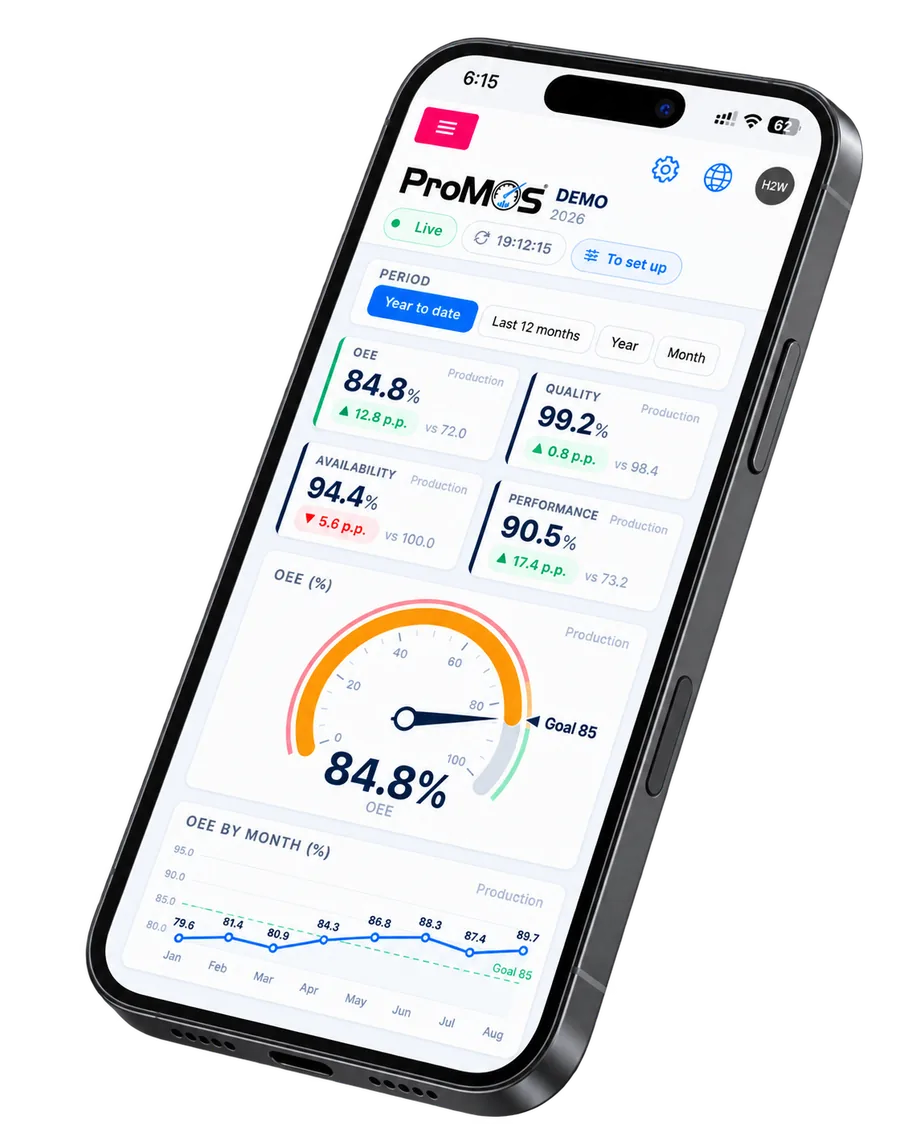
Inside the module
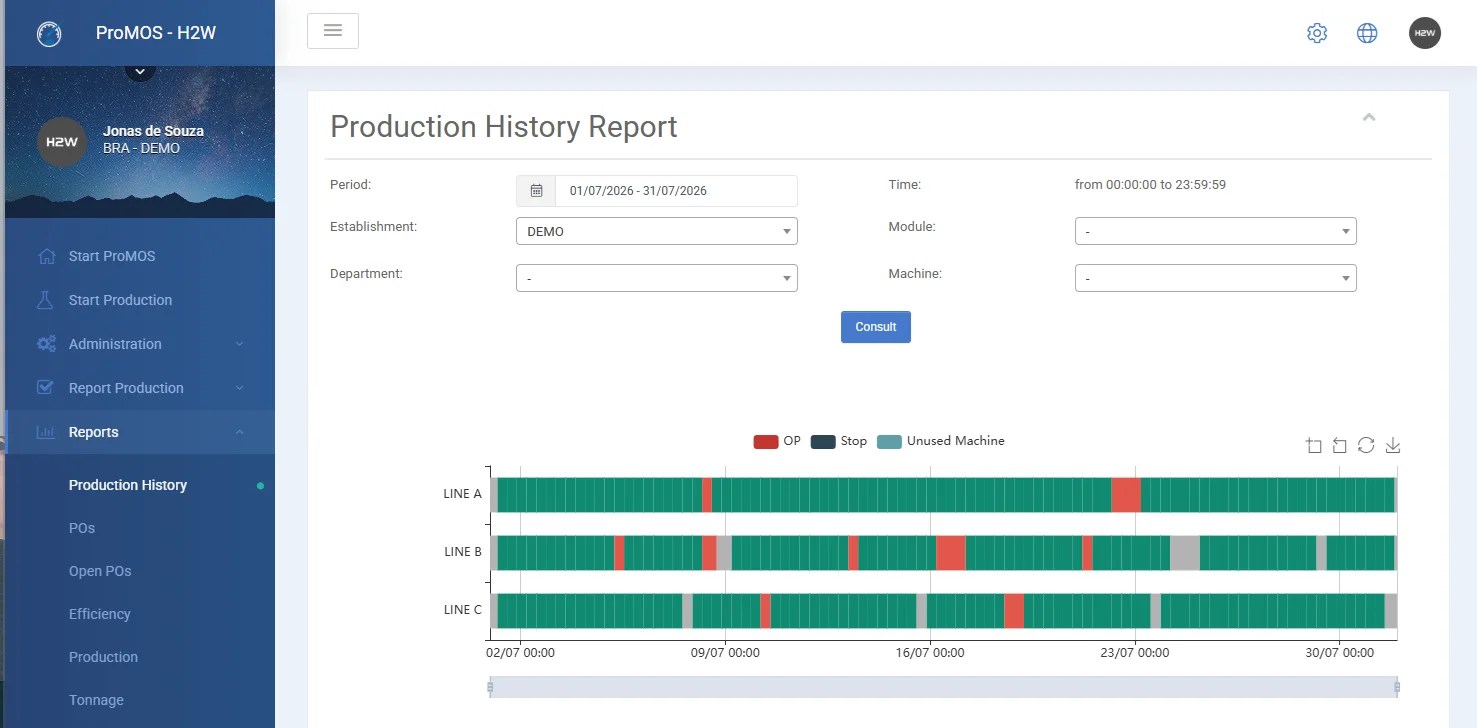
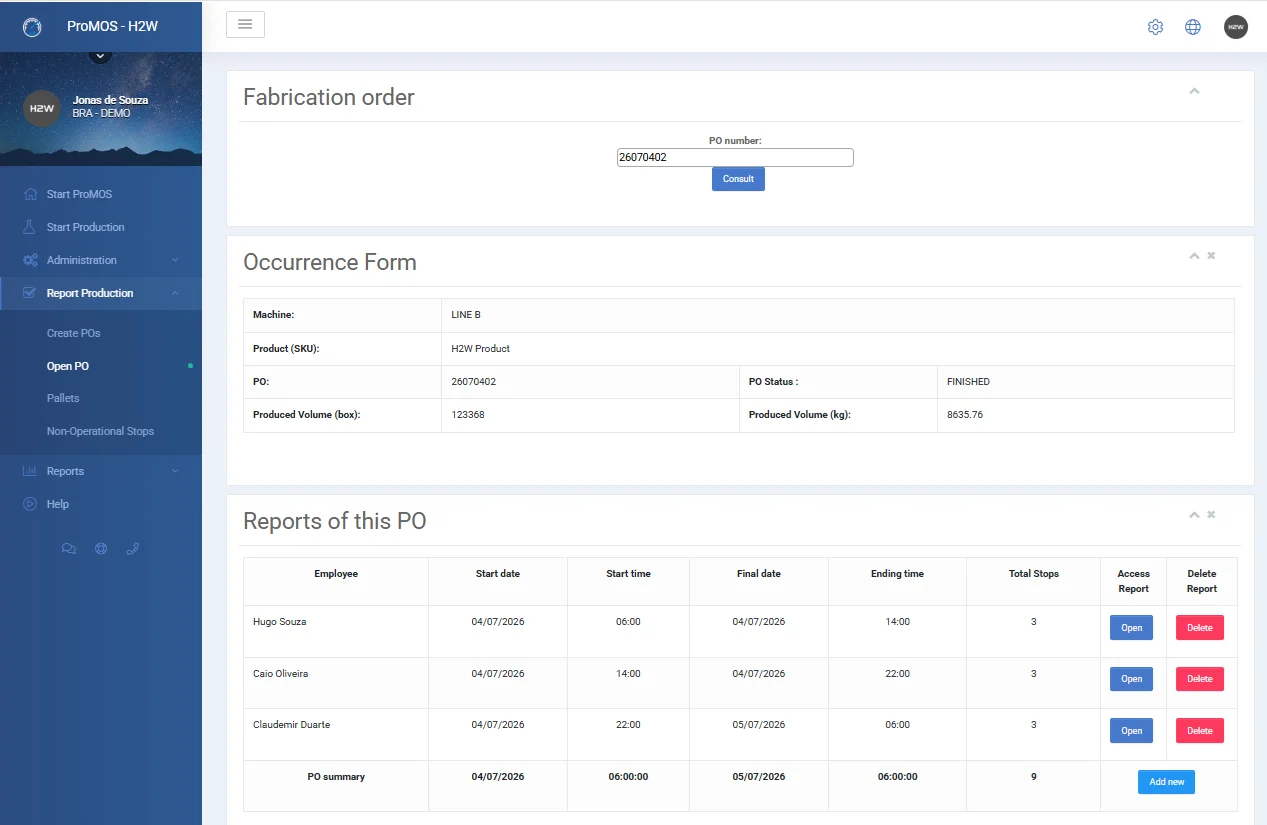
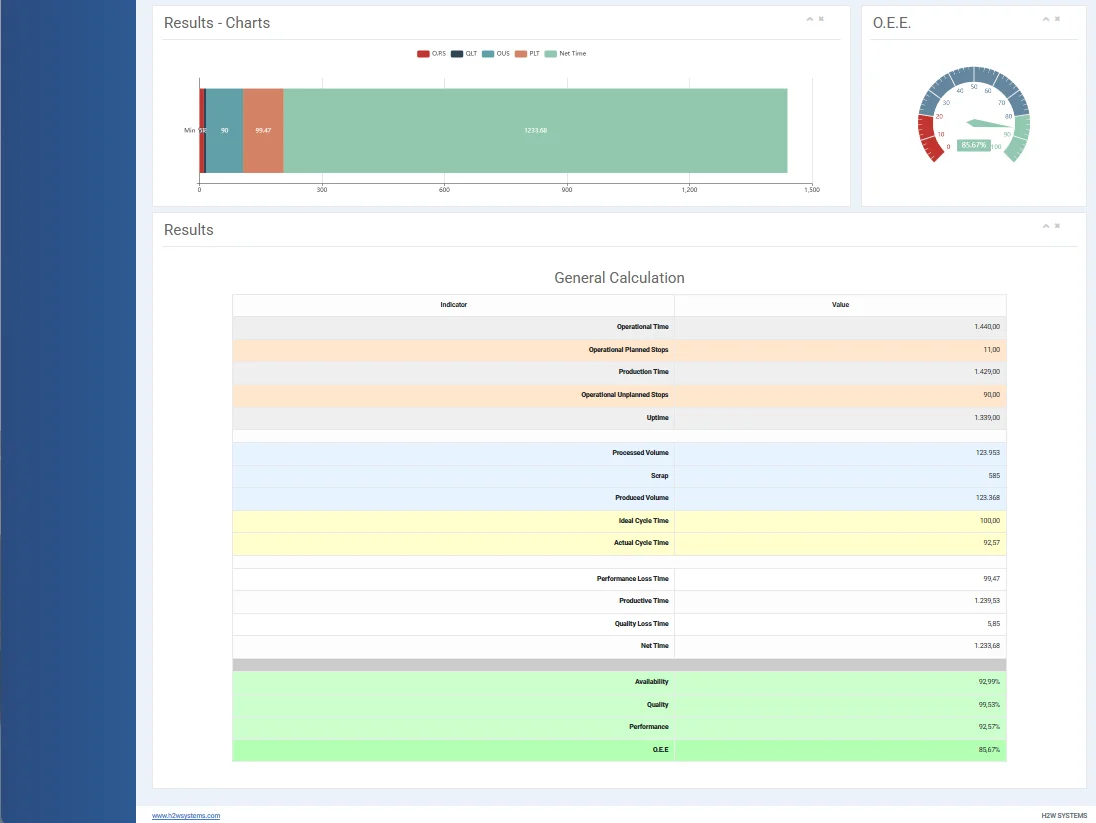
See the module from the inside
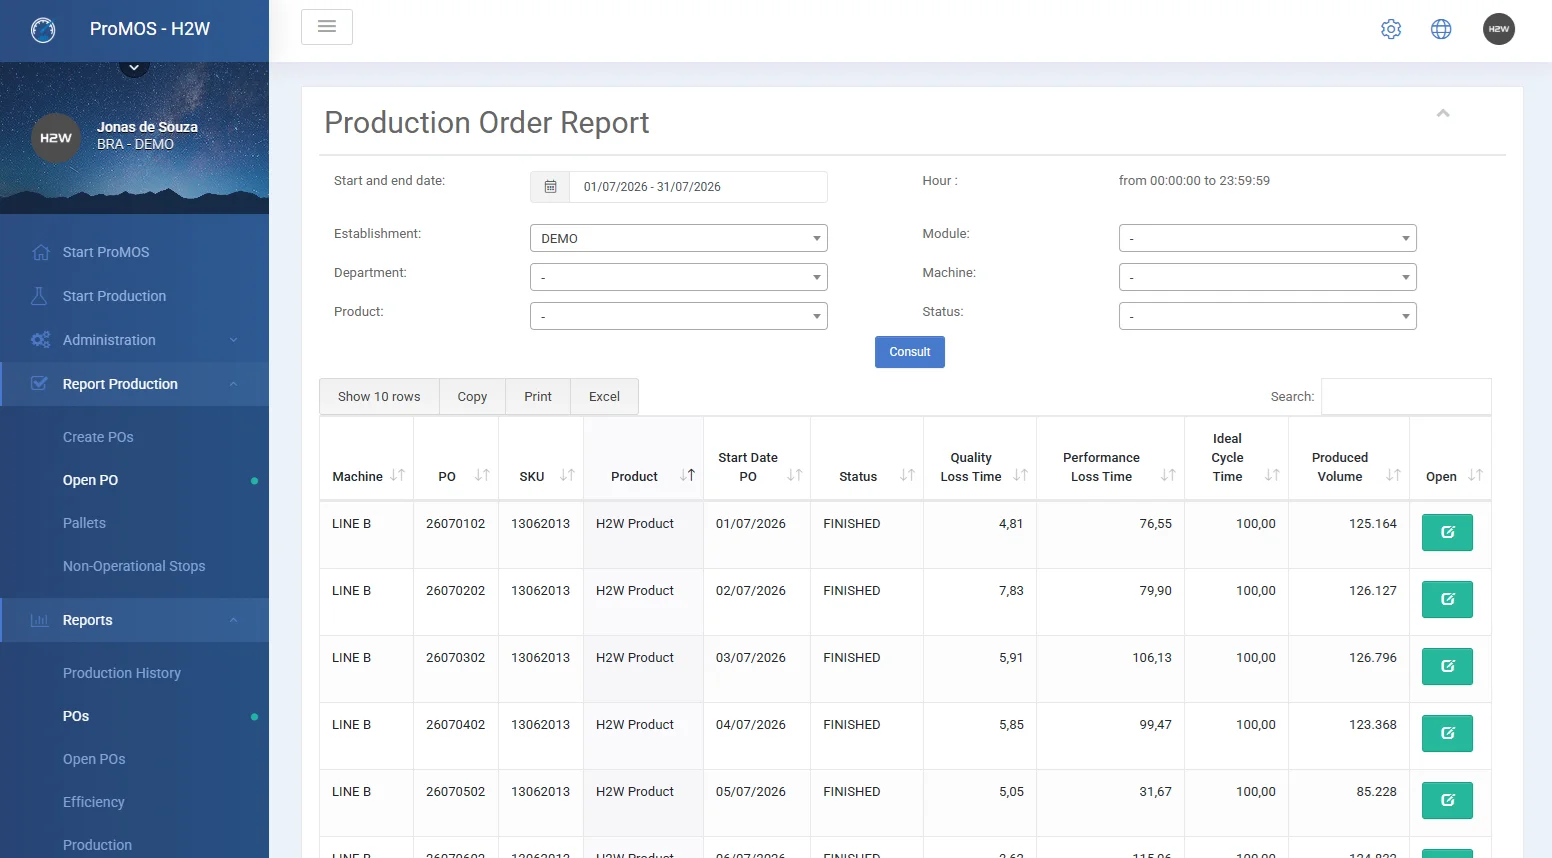
From management views to operator entries — browse the main screens.
Try it
Imagine your production seen like this
This simulator shows how your plant's data would look in ProMOS® BI, in real time. Play with the year, machine and shift filters — the indicators recalculate instantly.
Proven ROI
Measured results — and what they mean in cost
OEE gains recorded month by month in plants running ProMOS® — real production data, not estimates:
What +10 p.p. of reliability do to one line
Model with conservative assumptions, calibrated by the real gains from our cases (OEE from 55% to 65%)
Example based on assumptions from a reference industrial operation. The calculation is done line by line for each project.
Integrations
Connected to what your plant already uses
ProMOS® exchanges data with ERPs, SCADA systems and equipment — from product master data to automatic stop capture.
PLCs, sensors, scales and SCADA — or H2W apps — capture data straight from the equipment.
ProMOS® can receive data already registered in your ERP, avoiding rework.
Data arrives in many different ways — ProMOS® adapts to your software's interface and your company's rules.
With the data received, business rules define how it is validated and linked to production records, following your company's rules and calculations.
ProMOS® shows data and reports in real time, operators follow production online, and validated data can return to the ERP, avoiding rework.
The golden rule: wherever ProMOS® receives or sends data, your company's rules are enforced — information is validated in real time and only the data that truly matters to the business is used.
Integrated platform
The MES doesn't work alone
Each module works on its own and is optional — but together the gains multiply: a stop recorded in production becomes investigation, action and routine in the other modules. Watch the connections light up on the map.
 MES
MES
Why ProMOS® is different
A platform that evolves with your operation
ProMOS® adapts to the way your plant works, keeps pace with changes in the operation and connects different processes to turn information into continuous improvement.
Flexibility
Systems follow the H2W standard, but can be fully customized for your operation. ProMOS® is not a platform of closed, off-the-shelf products.
Continuous Evolution
ProMOS® keeps pace with the changes that arise in the operation, business rules, legislation, management and audits — and evolves with them.
Interconnected Processes
ProMOS® links the operation's processes together, making data entry easier and generating complete information.
Continuous Improvement
The indicator is just the start of the analysis. ProMOS® connects the information to understand what influences the result:
From operation to results.
Features
What the module delivers
The main features, for those who want to check item by item — and there's always more than fits here:
Main module features
Guided deployment
The module arrives ready to use: master data configured with your team and trained users.
- Initial setup of machines, products, rates, stop reasons and loss types, together with the plant team.
- Individual access per person, with profiles for general administrator, production operator (records, but does not administer) and regular user (reports only).
- Key-user training on production recording and indicator analysis.
Production master data and parameters
The structure the MES uses to calculate indicators is configured by the plant team itself, with no dependency on H2W.
- Machines and production lines, each with its own OEE targets.
- Products and the rate of each product on each machine — rate changes apply to new records without touching history.
- Operational and non-operational stop types, organized by classification and sub-classification, plus loss types.
- Period lock after closing: records before the last closing can no longer be changed, guaranteeing the integrity of results.
Production orders and recording
Operators record production directly in the system, which validates entries and calculates results on the spot.
- Production orders opened and tracked per production line.
- Recording by operator and shift (optional): one order can span several shifts and operators.
- Control of stops, with reasons, and losses; pallet and produced-volume records.
- Scheduled non-operational stops, so unscheduled periods don't count as loss.
- Result tracking by operator, shift, leader, product, order, line, cell, department, plant and period.
Production panel and home page
Production status is visible to the plant in real time.
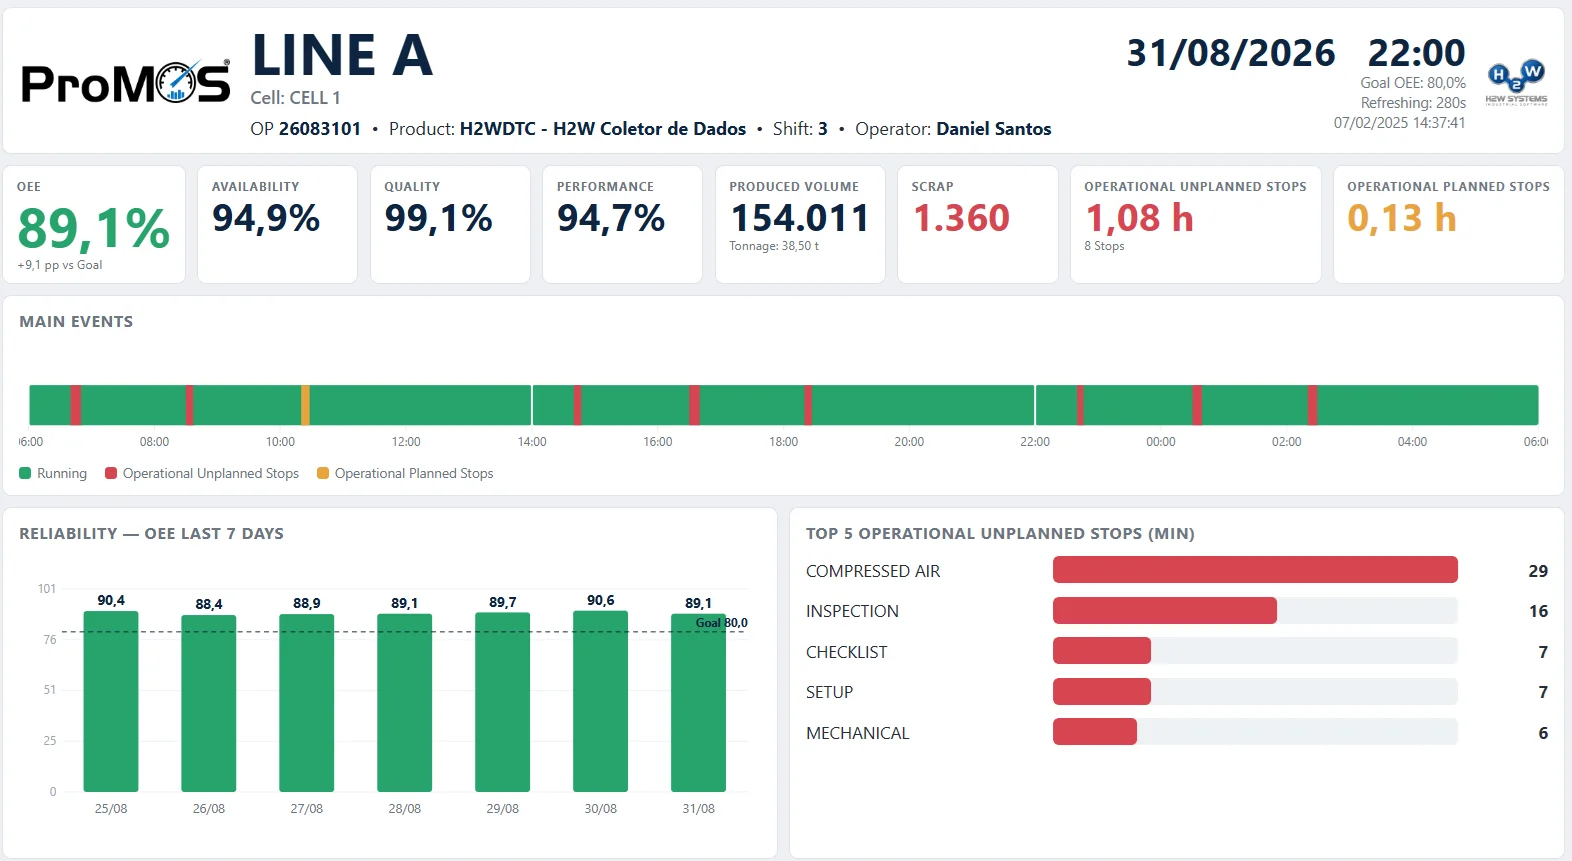
- Online panel per machine: status (running or stopped), product, operator, availability, performance, quality, volume, tonnage, scrap and the TOP 5 stops of the last 7 days.
- Module home page with the main production indicators.
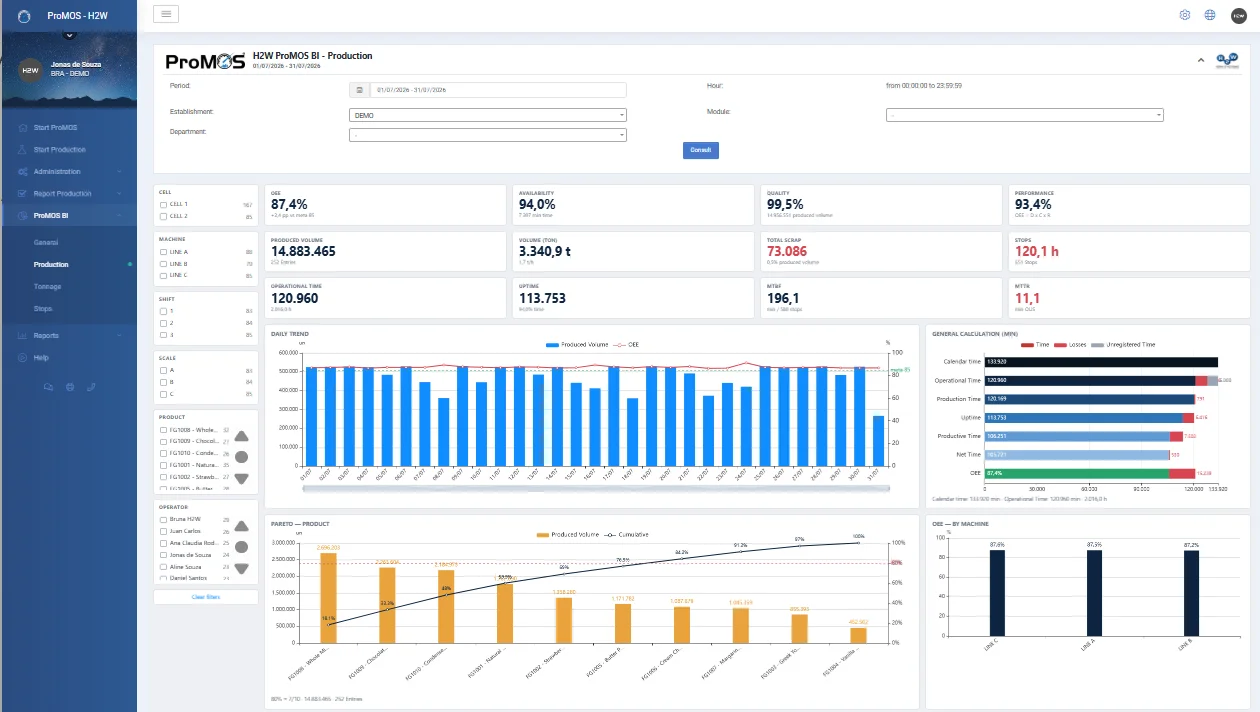
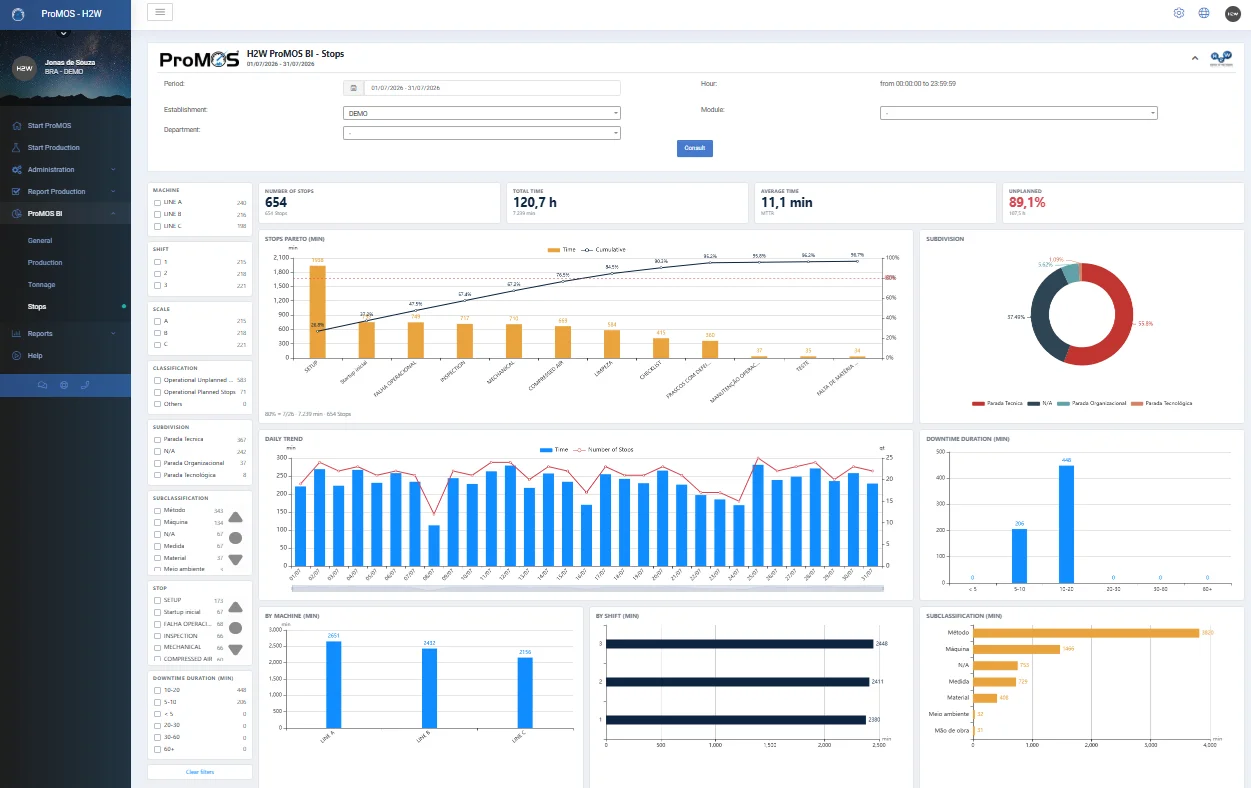
ProMOS BI Production, Stops and Tonnage
Configurable reports in Power BI format, with no Microsoft license required: native analysis of all recorded data, navigating by period, shift, schedule, machine, cell, product and operator.
- ProMOS BI Production: OEE and its components (availability, performance and quality), rate and quality deviations, calendar, operating, productive and net times, uptime, daily trend and Pareto.
- ProMOS BI Stops: stop Pareto, the stops that steal the most production time, daily-meeting view, number of stops and total/average times, by classification, sub-classification and reason.
- ProMOS BI Tonnage: produced and processed volume, weight and scrap by machine, product and shift, with daily trend.
Production reports
Ready-made reports for daily follow-up and historical analysis.
- Efficiency, production, production orders (including open ones), tonnage, losses, stops and detailed stops.
- MTBF and MTTR per machine.
- Production history on a timeline: all 24 hours of each line, without losing a minute.
- Hoshin: losses by classification (organizational, technical, technological, process and utilities) month by month, exportable for printing.
- OEE calculation formulas in PDF and data export to Excel.
Interfaces and automatic capture
The MES exchanges data with the ERP, SCADA systems and the plant's equipment. Data arrives in many different ways: ProMOS® adapts to the plant system's interface and to the company's rules. Each interface is contracted per line or equipment that uses it:
- ERP Interface – Master Data: receives from the ERP the master data the MES uses — production lines and equipment, products, products per machine with their rates, and stop reasons with their classifications — avoiding the rework of re-registering what is already in the ERP.
- Transaction Interface – POs, Pallets, Return: receives from the ERP the planned production orders and produced pallets, and returns to the ERP the result of each recorded order, with its stops, and the non-operational stops of each machine and day.
- PLC Interface – Stops: produced quantities and stops reach the MES automatically, captured from PLCs, sensors or the plant's SCADA. With the data received, business rules define how it is validated and linked to the production records, following the company's rules and calculations. If the internet is unstable, the period's data is stored and sent later.
In every interface the company's rules are enforced: information is validated the moment it arrives, incorrect or incomplete data is rejected and returned to the source system with the reason, and only the data that truly matters to the business is used. An interface report shows everything that was received. Without a contracted interface, production, stops and orders are recorded by operators on the module's screens.
Testimonials
What our clients say
"H2W SYSTEMS® has an excellent set of web-based solutions for Industrial Management. The cost-benefit ratio and ease of customization are great differentials.
I have known H2W® for a decade, since they began customizing and simplifying the information management systems for giant P&G. Since then, many other large companies have joined their portfolio, and they continue to be a reference in the industry."
"H2W's® custom-built systems have been driving unprecedented productivity growth across the departments in my company, and the cost-benefit is spectacular.
In fact, it is possible to use 100% of what is contracted, versus the closed systems sold in the market where only a small part is ever used."
"A responsible, young, dynamic international company with deep knowledge of its clients and, above all, with cutting-edge technologies and tailor-made developments that meet the required needs."
★★★★★
"A tool that handles complex operations in a practical, easy-to-understand way. Extremely functional — it has direct integration with applications like SAP."
★★★★
"I use this tool every day. Factory efficiency, number of tags opened and resolved — factors that contribute to our commitment to excellence in the market."
★★★★
"I use the software for training management — it helps me a lot in my daily work. It's practical, intuitive, and has excellent technical support."
★★★★
"A very reliable platform. Data is stored safely and nothing gets lost in the system. Easy to use, with comprehensive and simple reporting visibility."
★★★★★
"Practical to verify the required trainings for each employee and their status. I don't miss any feature in the software."
★★★★★
"Every time I needed help — regardless of the hour — they were ready to provide user support. The weighing label system is simple and fast."
Specialized Consulting
Beyond the software: consulting on production indicators
We help structure OEE, PR, reliability or any indicator your operation requires — with a methodology born from 20 years of practice in the world's best factories.
- Diagnosis of your current indicators and the data sources behind them
- Standardized calculation: OEE, PR, MTBF/MTTR and indicators specific to your process
- Team training and a management routine to sustain the gains over time

ProMOS®
Explore the other modules
Ready to improve your OEE?
Talk to our team and discover how ProMOS® can transform your production management.